A flurry of economic performance metrics released last week included some big surprises, so it’s a good time to recap what happened and assess likely impacts for the rental housing sector’s overall health.
U.S. Job Growth Falls Short of Expectations
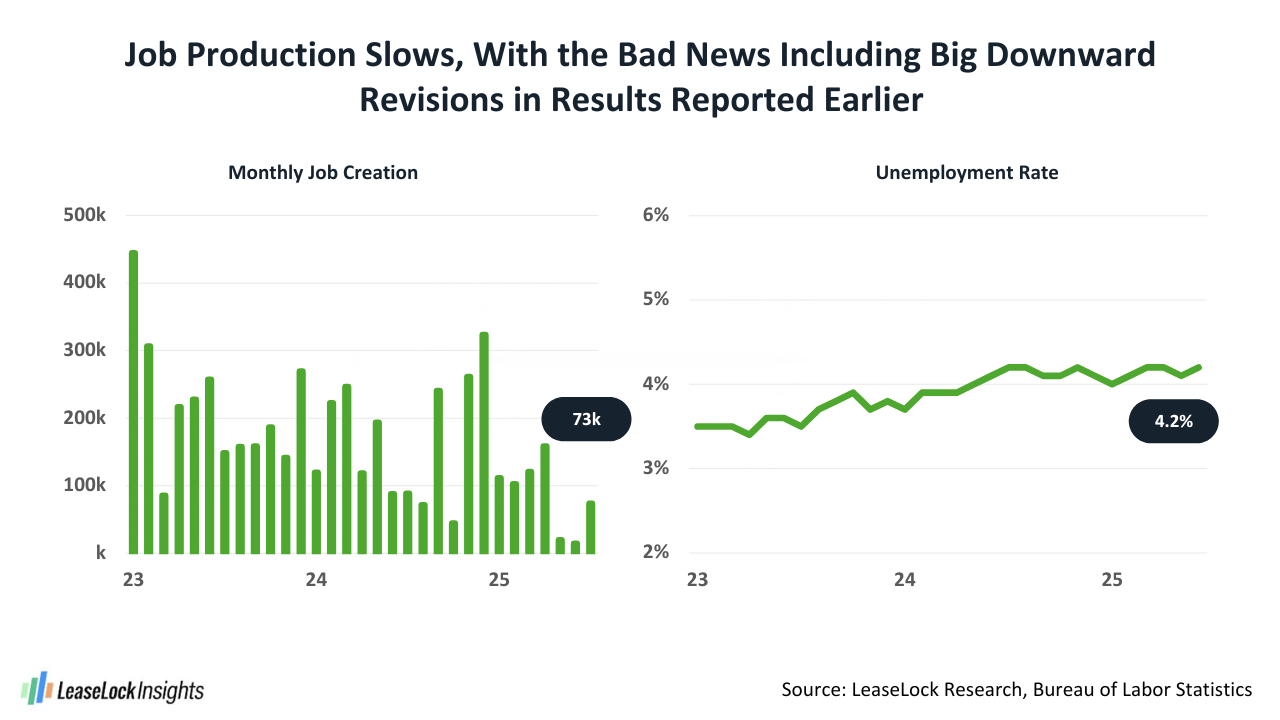
The major shocker for the week arrived in Friday’s jobs update from the Bureau of Labor Statistics (BLS). The initial estimate for July employment growth totaled just 73,000 jobs, well short of the tally of 115,000 to 120,000 jobs expected by economists. Even more stunning, the revised expansion levels reported for May and June plunged to a two-month total of just 33,000 jobs from the earlier estimate that had reached 291,000 jobs.
The latest figures on performance by key industry show that the healthcare sector is the only major job category now growing at a substantial pace. Data revisions wiped out notable expansion that had been reported previously for state and local government agencies. As has been the case for a while, recent results continued to lag in job sectors with comparatively high salaries: professional/business services, finance, and information (BLS-speak for technology).
Year-to-date growth in the employment base comes in just a hair below 600,000 jobs, or roughly 85,000 jobs per month. That’s not a bad seven-month result, since it’s similar to the increase seen in the working-age population. However, there’s now a big question mark about what comes next. The probability of recession in the short term has just surged, and we’ll see how economic forecasters adjust their expectations in the coming few days.
The nation’s unemployment rate for July ticked up a hair to 4.2%, still at a level that’s considered full employment by historical standards. Influencing that metric, the size of the labor pool is shrinking due to a drop in foreign-born workers. BLS figures show the count of immigrants in the workforce down by just over a million people so far this year. However, that drop could be overstated, given that some immigrants may not be identifying their foreign origins in a survey that consists of voluntary responses.
BLS Revisions and Labor Force Trends
While July’s revisions to the job production volumes released earlier for May and June were quite large, it’s important to realize that initial estimates are issued with a fully transparent and sizable stated margin of error. Adjustments to preliminary figures are routine, and those revisions have been becoming more pronounced for quite some time. Shaping that pattern, timely response levels to BLS surveys have dropped notably over the course of the past decade or so. The initial response rate in the survey of major employers and government entities now runs around 60%, down from roughly 80% a decade ago. For the household survey that the BLS does, responses collected in time to be included in the initial calculation for a given month have dropped to approximately 70%, off from about 90% going back 10 years earlier.
GDP and Inflation Metrics Raise Red Flags
New stats produced last week for the nation’s Gross Domestic Product (GDP) and the Personal Consumption Expenditures (PCE) Index also raised some concerns about the state of the U.S. economy.
While the top line reading for second quarter GDP (3% expansion) was solid, that figure mainly reflected a pullback in the huge imports volume that had tanked the first quarter GDP result. Digging deeper into the stats, there was a sharp slowdown in the growth levels seen in both business investment and consumer spending, indicating meaningful negative impact from tariffs and a bump in inflation.
The PCE Price Index, which is the measure of inflation that weighs most heavily when the Federal Open Market Committee makes banking interest rate adjustments, came in at 2.6% year-over-year, trending upward and slightly surpassing expectations. Similarly, Core PCE, which excludes the volatile results for energy and food, accelerated too, reaching 2.8% on an annual basis. Thus, higher inflation that can alter spending patterns and slow economic expansion seems to be taking hold.
Rental Housing Demand Outlook for 2025
Slowing job production erodes underlying support for new household formation and absorption of housing, including rentals. Demand for U.S. apartments during 2025’s second half, then, now appears likely to cool from the net move-ins pace realized year-to-date. However, since absorption posted in January-June, north of 300,000 units, was running so far ahead of LeaseLock’s initial forecast of the likely performance in 2025, a slowdown in leasing during the coming months suggests that the earlier forecast of demand for 400,000 to 450,000 units during the calendar year could prove on target.
The competitive leasing environment that seems to lie just ahead will make it tough to achieve much, if any, further rent growth for new resident leases. However, there’s room to lose some pricing power and still keep annual rent change about where it is right now, as effective rents for new leases backtracked by roughly 0.5% during the last half of 2024. Calendar 2025 new lease rent growth, then, should land close to 1%. Rent growth for renewal leases when households opt to stay put at initial lease expiration now registers between 3% and 4%, and there’s no reason to think that performance will move much for the remainder of the year.
About LeaseLock
LeaseLock is the only true lease insurance provider for rental housing. Our AI powered underwriting program, LeaseLock ShieldTM, predicts risk and optimizes coverage for properties and portfolios. Owners and operators gain notable profit protection while accelerating leasing, minimizing burden, and removing reputation and legal risk. With over $14 billion in leases insured, LeaseLock is reshaping the way the rental housing industry manages financial risk, while delivering significant benefits to renters. As an accredited GRESB partner, LeaseLock is dedicated to improving housing accessibility by offering renters greater financial flexibility while protecting properties against the risk of bad debt.


