Mid-Month Update: May Rent Payments Remain Stable, But Class C Residents Are Struggling
Now that we’re halfway through the month, we’ve decided to take a mid-month look at rent payment behavior through May 15 to evaluate any shifts since our Rent Payment Report.
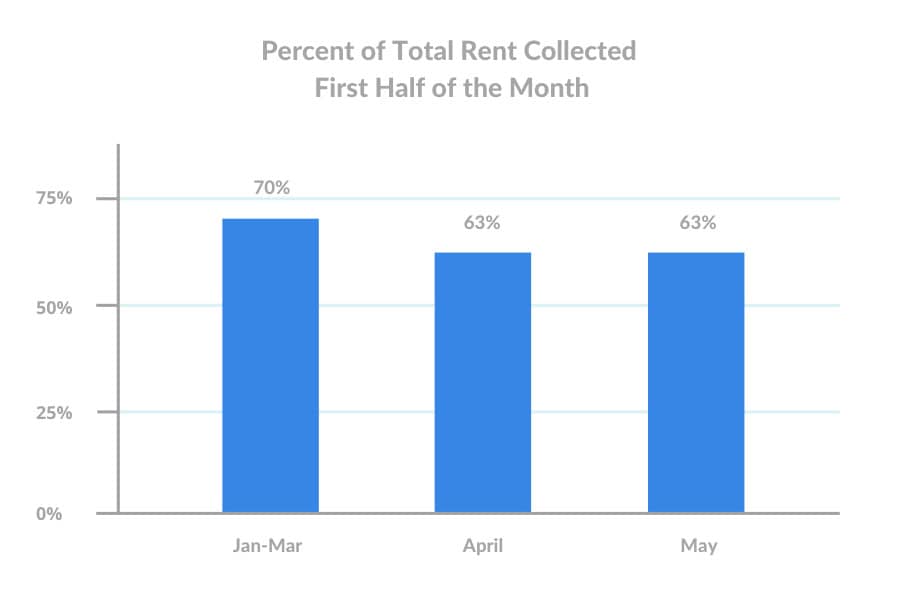
Rent collected in the first half of both May and April was down 7 percentage points from the pre-COVID average. However, May rent payments have held steady since April — contrary to some analysts predictions of further declines.
 Despite the steady payments, the future of rental housing remains uncertain as federal assistance dries up in coming months, especially for working class communities battling ongoing unemployment and loss of income.
Traditionally, Class C properties house lower-income residents, many of whom have been directly impacted by COVID-19 service industry layoffs. We’ll take a closer look at payment behavior among Class C properties specifically, and how it may foreshadow some of the challenges expected across the multifamily industry as the pandemic wears on.
Mid-May Rent Payments Start Strong Then Trend Downward
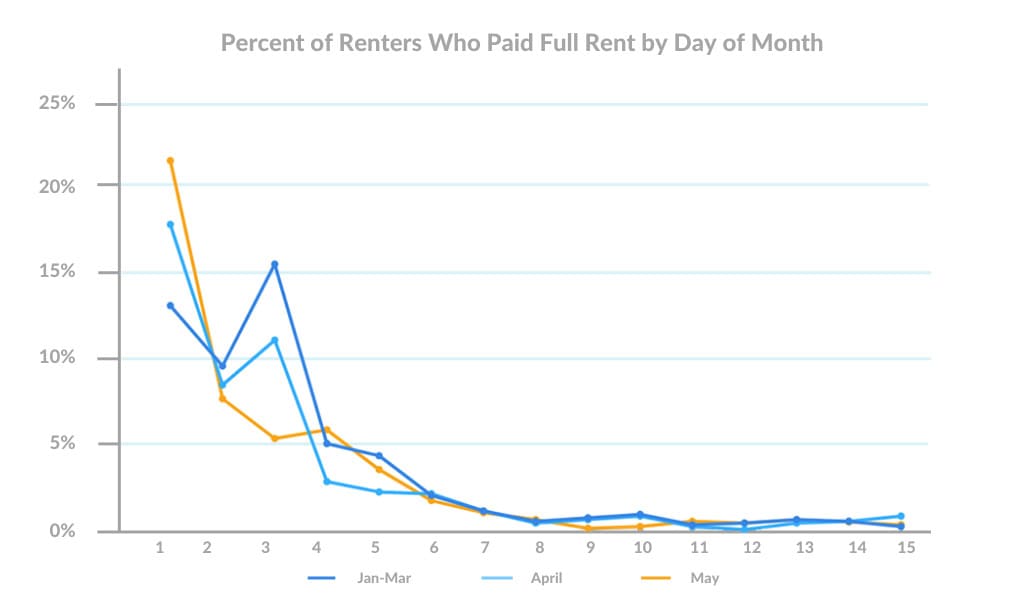
May rent payments hit a record-breaking high on the first of the month, eclipsing even the pre-COVID average for first-of-the-month payments. This suggested that, as federal relief and unemployment checks rolled in, Americans who could pay were prioritizing rent payments.
However, since the first of the month, May rent payments rapidly tumbled. A slight bump was seen at the end of the May grace period (typically the first five days of the month), but since then payments have tracked below average.
Class C Rent Payments Show Sharpest Decline
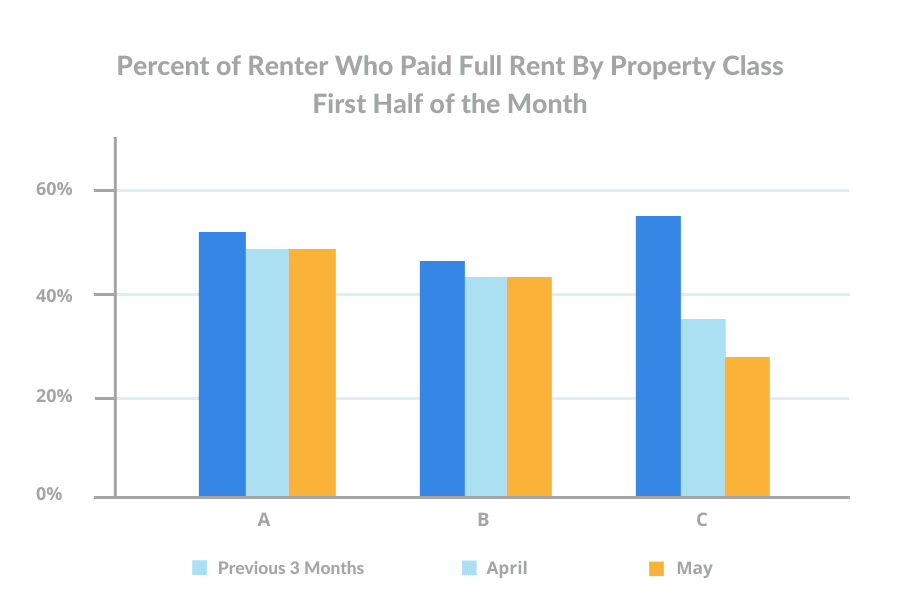
While rent payments are holding relatively steady in May, asset class C properties have seen a sharper decline. Rent payments remained stable for class A and B properties between April and May, however Class C properties have experienced a 7 percentage point drop in total rent collected from April — and a sizable 26 percentage point drop from the average.
Class C Residents Biggest Adopters of Payment Plans
As Class C renters show signs of struggle in making their rent payments, operators are working hard to support those experiencing financial hardship by devising payment plans.
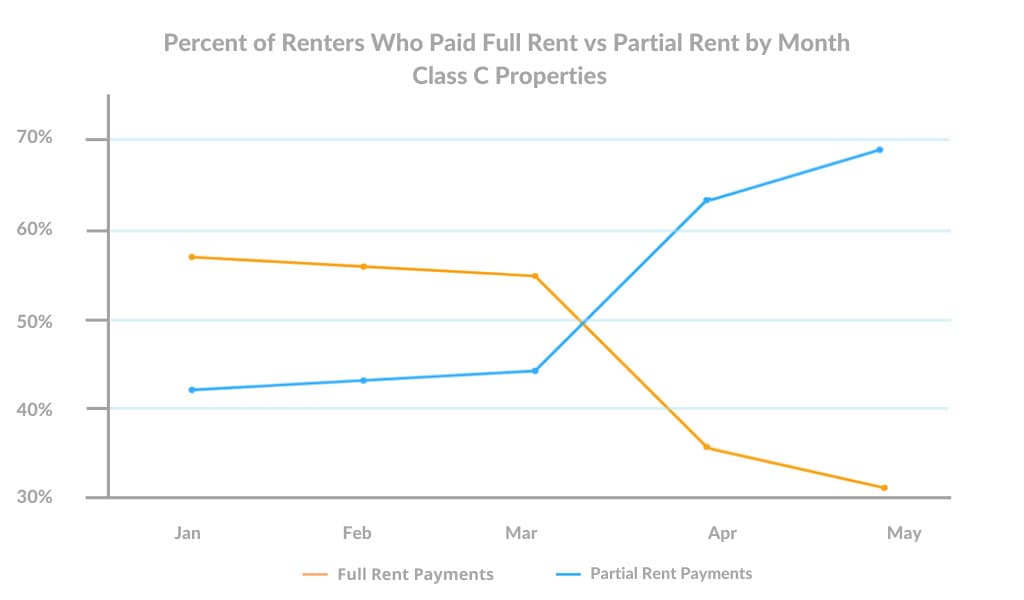
When compared to pre-COVID behavior, there has been a 27 percentage point jump in partial payments among Class C residents, suggesting a strong trend toward payment plans and alternative payment arrangements — these now represent 70% of all rent payments among Class C properties, compared to only 54% for Class A and B.

What Is the Outlook for Multifamily During COVID?
After a considerable amount of apprehension leading up to May, multifamily operators have reason to be cautiously optimistic about actual rent payment behavior. Operators are doing everything they can support residents in need of assistance — and renters who can pay, are doing so.
However, there’s no doubt that the COVID-19 pandemic has strained the U.S. economy, and its effects on the working class are even more pronounced. Workforce housing has a higher percentage of service workers with little to no access to savings or credit safety nets, meaning Class C renters will continue experiencing more difficulty paying rent in the coming months as relief checks and unemployment benefits dry up.
Multifamily has proven to be resilient through most of the crisis, but mass economic tension inevitably means that properties of all class types are vulnerable. In other words, the cracks forming in Class C properties may bleed into Class B and Class A properties eventually.
The Ripple Effects Of Struggling Class C Renters
As fewer Class C properties are able to afford monthly rent, it has a domino effect — with significantly less rental income, properties can’t make mortgage payments, which affects banks, and then ripples throughout the wider economy. Factor in a rising unemployment rate (14.7% unemployment rate in April and projected to trend higher) and the worsening financial outlook we’re observing across Class C properties may be a harbinger of Class A and B residents in the months ahead.
Property managers’ ability to pay lenders hangs in the balance. What will apartment operators do when their mortgages continue to pile up and residents face mounting financial pressure without a national rental bailout plan? Federal mortgage forbearance is only available for federally backed mortgages, meaning operators simply don’t have sufficient protection in place. Subsequently, it could cripple a significant sector of the rental housing industry.
This is why multifamily operators and associations across the country have been rallying behind a proposed $100 billion in rent relief to help America’s renters. While several states have begun pulling together a patchwork of rent assistance programs across the country, funding, availability, and pay-outs have been inconsistent. Apartment communities and their residents still need immediate federal rent funds to help prevent a potential rental housing crisis.
For now, we will continue to track rent payment data to provide insights on what it means across asset classes, and for the multifamily industry as a whole. Look out for our rent payment analysis after June 1st.
Methodology
Rent payment data is actual transactional data sourced from integrations with property management systems in the multifamily industry.
Analysis includes a 96,268 unit sample from 1,029,428 live units under management by LeaseLock clients. Data is nationwide, representing over half of the NMHC Top 10 property managers in the country and all asset classes (A, B and C). Asset class composition: class A (36%), class B (55%) class C (9%).
All data has been anonymized to remove personally identifiable information for renters and property managers.


