Running on Empty
How Financially Fragile is Today’s Renter?
Author: Janine Steiner Jovanovic
September 15, 2026
While some macroeconomic indicators suggest a growing economy, the financial reality for many American renters is increasingly precarious. The burden of inflation – especially the rising costs of household necessities – has created an economy where middle-class margins are actively shrinking and housing affordability is stretching to its limit.
To sustain occupancy and preserve asset value in a marketplace where property performance results are increasingly bifurcated, housing providers must adopt solutions that align with modern household finances.
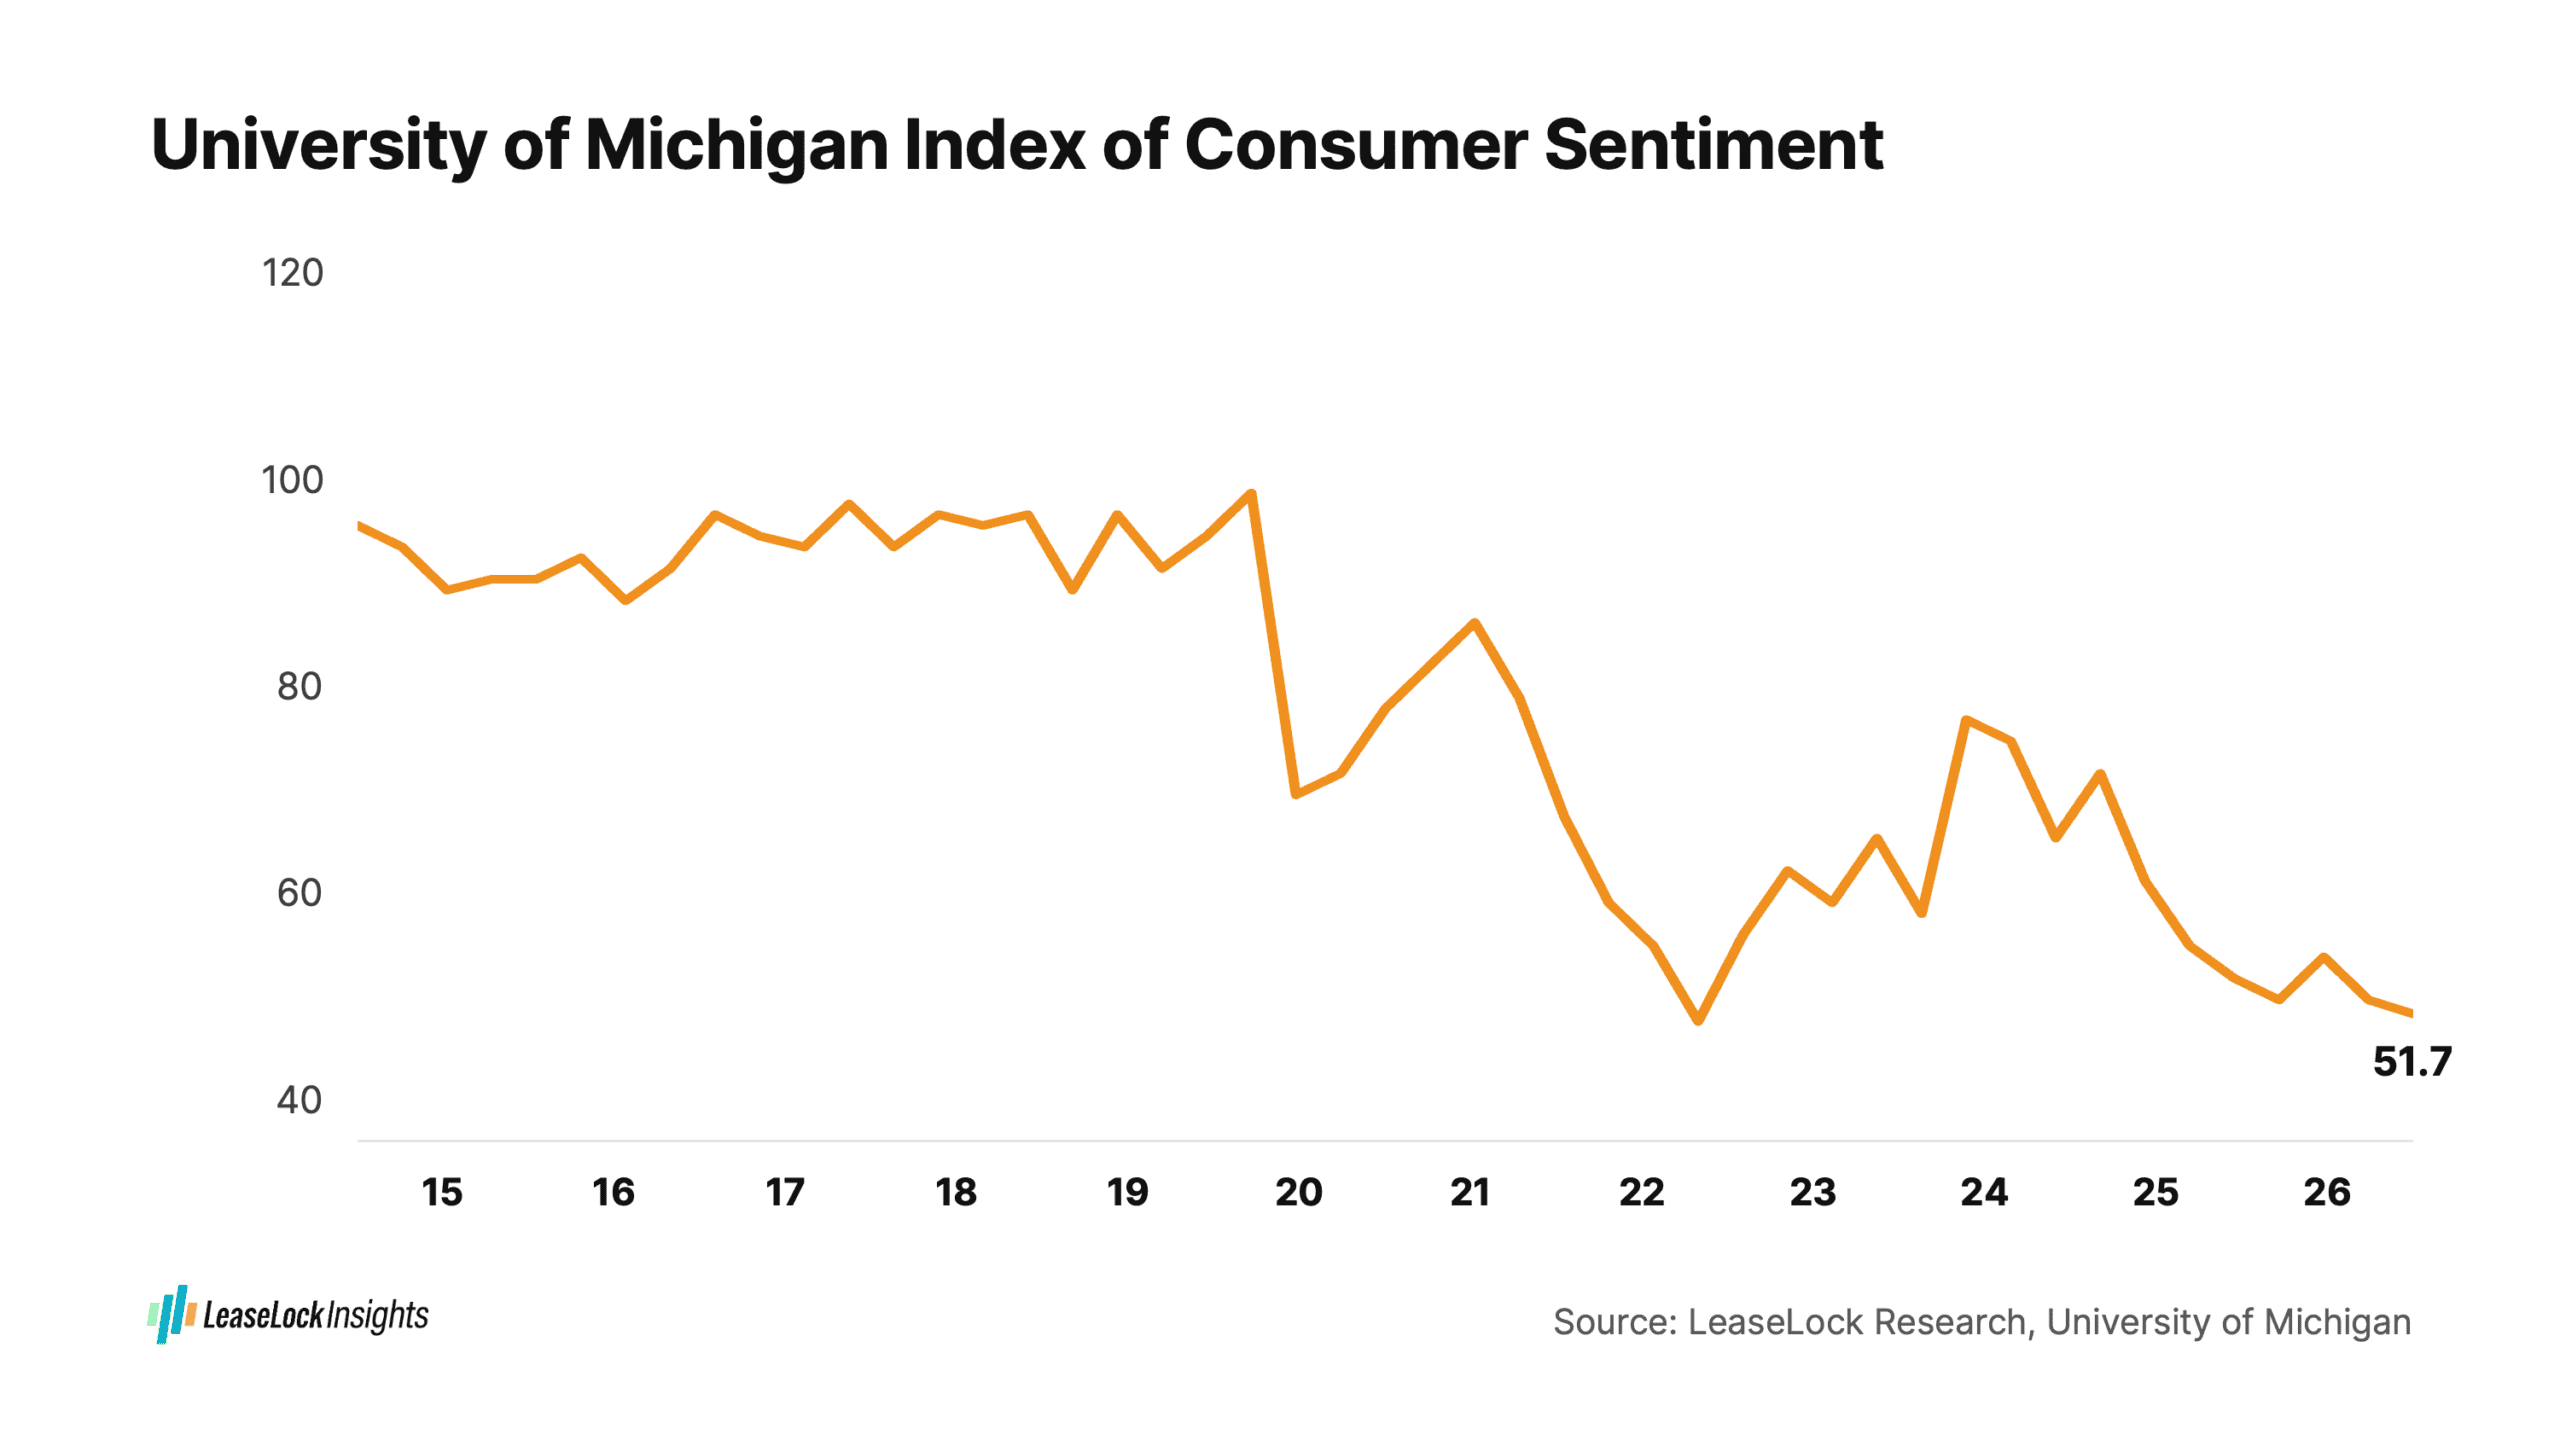
Many households are reporting pronounced financial stress. Consumer sentiment sits at the lowest levels seen in decades, dampened largely by near-term inflation expectations and a slowing of annual wage growth.
The financial pressures once heavily concentrated among lower-income households are increasingly impacting middle-income earners, who comprise half the renter base.
The erosion of the financial safety net for renters is evident across multiple economic indicators:
Nationwide household growth has slowed for the third consecutive year, and job growth in the highest-paying industries (Business Services, Finance, and Information) has flatlined nationally.
Market performance is segmented, however, with pockets of job growth in high-paying sectors emerging in Austin, Charlotte, Dallas-Fort Worth, Nashville, Raleigh and Salt Lake City.
Housing affordability is guaranteed to be a central theme in the upcoming presidential election. As the political spotlight intensifies on consumer needs, the housing industry must prepare for more regulatory action.
States and municipalities are already imposing rigid caps on move-in costs and adding increasingly complex administrative requirements. While legislative intervention plays a vital role in the housing market, long-term stability requires private sector solutions that strike the right balance in preserving both renter and property financial health.
Housing providers have broadly turned to move-in concessions in response to these market dynamics. By mid-2026, the share of rental listings offering move-in concessions reached 39.8%, with rates nearing or surpassing 60% in high-supply markets.
The impact? Rising delinquencies have become a key vulnerability for housing performance, with move-out balances now exceeding three times the average security deposit collected. Paired with minimal recovery rates, this bad debt guarantees NOI deterioration and compromises asset preservation.
Meanwhile, billions in vital renter liquidity is locked away in residential security deposits across the U.S. When renters are forced to surrender their available cash for a security deposit, it eliminates a vital layer of financial stability for the renter and for the property they live in.
Renters are actively demanding relief: 69% report that security deposit alternatives are important to their financial health. Lease insurance empowers them to maintain liquidity and financial security, avoiding the cycle of predatory debt, and providing properties with the protection required to maintain our nation’s housing.
Surety bonds and similar deposit alternatives have failed to solve the need. They exclude renters through secondary qualification, and act as delayed debt instruments, pursuing renters for collections when claims are paid, threatening their credit health when they are most vulnerable.
With lease insurance from LeaseLock there is no secondary renter qualifications process and no renter collections ever.
In an increasingly unpredictable economic landscape, modern financial instruments are the catalyst for ensuring a resilient, sustainable rental housing ecosystem. Private sector innovations like lease insurance are essential for safeguarding the stability of America’s housing.
[1] University of Michigan Surveys of Consumers. (2026, September 11). September 2026 preliminary results. Institute for Social Research, University of Michigan. https://www.sca.isr.umich.edu/
[2] Joint Center for Housing Studies of Harvard University. (2026). America’s Rental Housing 2026. Harvard University. https://www.jchs.harvard.edu/americas-rental-housing-2026.https://www.jchs.harvard.edu/blog/affordability-challenges-and-composition-middle-income-renters
[3] Mark Zandi, Moody’s Analytics, analysis of Federal Reserve data, as reported by Bloomberg and summarized by NewsNation and Fox Business. Consumers in the top 10% of the income distribution accounted for approximately 49.2%-49.7% of total U.S. consumer spending in 2025.
[4] Zandi, Mark, Moody’s Analytics, as reported by Fox Business, February 25, 2025. Spending by top-decile earners rose 12% year over year, while spending by lower- and middle-income households declined.
[5] U.S. Bureau of Economic Analysis. (2026, July 30). Personal saving rate. U.S. Department of Commerce. https://www.bea.gov/data/income-saving/personal-saving-rate.
[6] Board of Governors of the Federal Reserve System. (2026, May 13). Economic well-being of U.S. households (SHED). Federal Reserve Board. https://www.federalreserve.gov/publications/report-economic-well-being-us-households.htm.
[7] Federal Reserve Bank of New York. (2026, August). Quarterly report on household debt and credit: 2026 Q2. Center for Microeconomic Data. https://www.newyorkfed.org/microeconomics/hhdc.
[8] Board of Governors of the Federal Reserve System (US). (2026). Commercial Bank Interest Rate on Credit Card Plans, Accounts Assessed Interest (TERMCBCCINTNS). Federal Reserve Bank of St. Louis, FRED.
[9] Real Estate Technology & Transformation Center (RETTC) & National Multifamily Housing Council (NMHC). (2024). RETTC/NMHC Renter Insights Survey. RETTC. https://rettc.org/resources/rettc-nmhc-renter-insights-survey.

The industry is being redefined by persistent affordability challenges, a housing shortage, and rapid technological advancement. Executive Outlook is a forum where we explore the forces shaping rental housing and provide the intelligence needed to navigate the future.